
Plan
Write the setup before you buy
Before you buy, record the setup, the level, the stop and the thesis. For a stock position held days or weeks, the plan is what you review against later — not a number you rationalise after the fact.
Plan the trade, sync the execution, review it against the plan, and see which of your stock setups actually pay — with delivery charges and MTF interest already subtracted, so the P&L you're judging is the real one.
Auto-sync from 35+ brokers · Delivery & MTF aware · Built for Indian equity traders
Before you buy, record the setup, the level, the stop and the thesis. For a stock position held days or weeks, the plan is what you review against later — not a number you rationalise after the fact.
Buy and sell in your broker as normal. QbarTrade is read-only and SEBI-compliant — it never places orders, it records them.
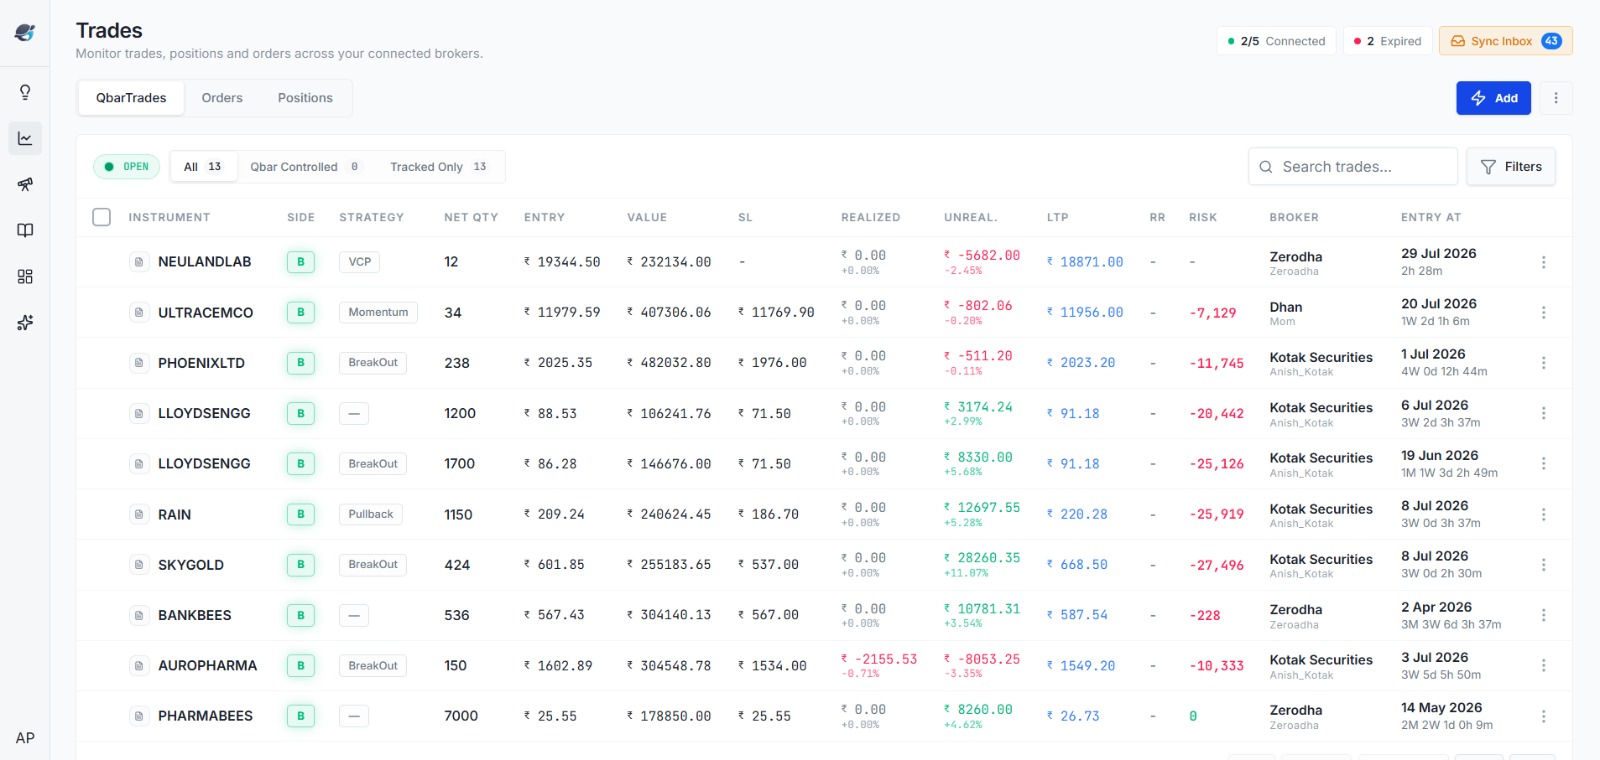
Every closed stock trade sits beside the plan you wrote, with your notes and the outcome. Delivery brokerage, STT, exchange fees, GST and stamp duty are subtracted, so a trade's real profit isn't hidden by charges you never added up.
Most stock trades are held for days or weeks, and that's exactly where a journal earns its keep: a swing position carries its entry logic, stop, target and every note from the hold, so when it closes you review it against the thesis you started with. Holding period becomes a number you can study — did the winners run and the losers get cut, or the reverse?
Buy a stock on margin and the broker funds part of it, charging daily interest that settles on the ledger — never subtracted from the trade's P&L. On a multi-week stock hold that interest is real money, and most traders measure their MTF returns gross without it. QbarTrade tracks the funding per position and reports P&L after it, so a funded stock trade's profit is the number that actually hit your capital.
Tag every stock trade by setup — breakout, pullback, reversal, whatever you run — and a year of scattered trades becomes an answer. Which setup makes money and which one you keep taking despite the numbers. Which sectors you trade well and which you should leave alone. How your win rate and average R change by holding period. A broker statement can't tell you any of this; it only knows what you traded, not which pattern was worth trading.
Illustrative example — your own tagged trades populate this.
Illustrative example — R is profit measured in multiples of risk.
Illustrative example — net of charges, per sector you traded.
Figures above are illustrative and do not represent any actual account or guaranteed result. This is educational software for reviewing your own trading — not investment advice.
Thesis, level, stop and target — written down before the buy.
Trade in your broker; QbarTrade syncs the execution automatically.
Outcome beside the plan, net of delivery charges and MTF funding.
Tag, analyse, and let the AI coach surface the patterns you'd miss.
The last step is where improvement compounds — let the AI trading coach surface the patterns you'd otherwise miss.
A record of your equity trades that goes beyond the broker statement — capturing why you entered, the plan, the outcome net of charges, and which setups actually make money, so you can improve rather than just trade.
The broker report shows what you traded and the result; it can't show your plan, your discipline, or which pattern is profitable. The journal adds that layer.
Yes — delivery charges are subtracted automatically, and MTF funding interest is tracked per position so your net P&L is accurate.
Yes. Tag trades by setup and the analytics show win rate, average R and P&L per setup, holding period and sector.
Yes — executed stock trades import from your broker's order book; no manual entry.
You can start free with every feature. Start with the free trading journal.
Free to start · auto-sync · delivery & MTF aware · read-only · no signals · no guaranteed returns.
Start freeExplore the rest of QbarTrade