
A politician makes a bold promise.
Before you decide what it's worth, you'd want one fact: how many people were in the hall?
The same words to eleven bored people and to a roaring stadium are not the same event. The words are identical. The commitment behind them is not.
Price is the words. Volume is the hall.
Under every candle sits a number: how many shares actually changed hands during that round. Beginners treat it as decoration. It is the chart's lie detector — because of one asymmetry this whole chapter rests on:
Price can be moved by very little money. Participation cannot be faked cheaply.
In a quiet market, a modest order can push price surprisingly far — words in an empty hall. But heavy volume requires enormous amounts of real stock to actually trade. Chapter 02's elephant, remember: it can hide its intentions; it cannot hide its size. The volume bar is the water level of the pool, printed under every single round.
So volume answers the one question price alone never can: *how many meant it?*
Three readings cover nearly everything:
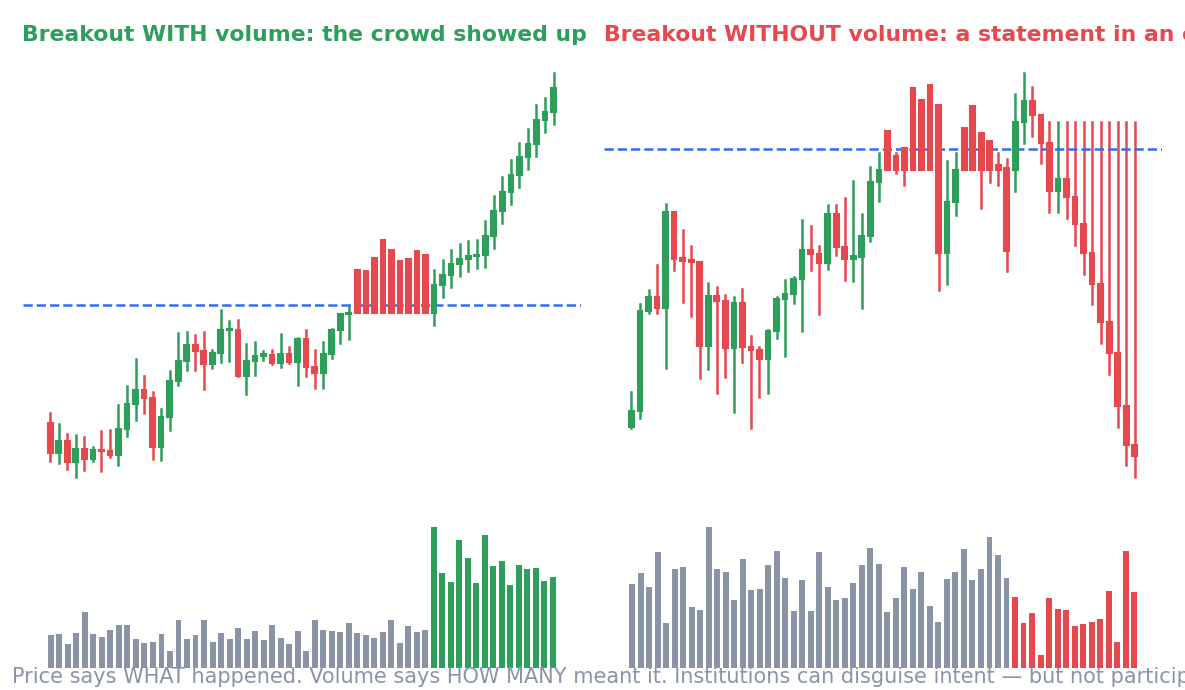
One — confirmation. A move with swelling volume is a packed stadium: broad, real, funded. This is why the dam chapter demanded volume behind breakouts, and why your candle triggers from Chapter 06 want a full hall behind them: a rejection wick on huge volume means a large someone did the rejecting.
Two — suspicion. The same move on thin volume is the empty hall. The breakout candle looks identical; nobody meaningful came. These are the breakouts that collapse back into the box within days — the fake the Playbooks warned you about, exposed in one glance downward. Rallies inside downtrends on shrinking volume read the same way: not eager buyers — merely resting sellers.
Three — the professional reading: effort versus result. Ask of any candle: how much effort (volume) went in, and how much result (price movement) came out?
Huge effort, huge move: normal.
Huge effort, NO move: stop and stare. Enormous energy was spent and price barely budged — only possible if someone absorbed the entire push. A monster volume bar with a tiny body, after a long decline, at a memory zone, means panicking sellers threw everything they had... and one patient buyer took all of it without letting price fall. You cannot see the whale. You can see the hole its absorption left in the physics. This is Chapter 02's boring range, at candle resolution — and it's how Chapter 05's accumulation looks up close.
Three quick footnotes, then your checklist completes:
Volume is comparative. 'Heavy' means heavy versus that stock's own recent average — not versus another stock, and mind the days volume inflates mechanically (expiry, index events, results).
Climax volume marks emotion. The biggest bars on any chart cluster at panicked bottoms and euphoric tops — maximum humans capitulating at once. A volume explosion after a long move is usually the crescendo, not the overture.
And VWAP — the Playbooks' intraday 'owner' — is volume inside an average: the day's fair price, weighted by how many actually voted at each level. Even your averages run on the hall count.
Your checklist gains its final question:
#4 — confirmation: is the hall full? Location, tide, trigger... and now participation. Four questions. Four chapters. One case.
Time to hold court.
Key Takeaway
Price says what happened; volume says how many meant it — and participation can't be faked cheaply. Demand full halls behind breakouts and triggers, distrust empty-hall moves, and master effort-vs-result: huge volume with no progress = someone enormous absorbing. Checklist question #4: is the hall full?
Think About It
The last breakout that trapped you — go pull up that day right now and look under the candle. Was the hall full? Was the answer sitting there the whole time, one glance below where you were looking?
Chart Lab — Check the Hall
Add volume bars and a 20-day volume average to your daily chart.
Find, over six months: one breakout on volume well above average and one below it — track each for two weeks after. Then find the three biggest volume bars on the chart: did each sit at a panicked low, a euphoric top, or mid-trend? What followed?
Finally, hunt one effort-vs-result anomaly: a huge-volume day with a tiny body, ideally at one of your memory zones. Write the whale story: who absorbed, from whom, and what happened next.
Then install the two-second habit, permanently: no candle gets believed until you've glanced at its hall.