
Run this experiment on any investor you know.
Find someone who bought a stock at ₹500 and watched it sink to ₹400. Ask: "What will you do if it climbs back to 500?"
You already know the answer. You've probably given it:
"I'll exit at my price. Just let me get out even."
Now zoom out. It wasn't one person who bought around 500 — it was thousands, wherever heavy trading happened. Every one of them nursing the same wound, whispering the same promise. The Psychology school told you why the promise is irresistible: losses hurt about twice as much as gains feel good, and getting back to even is the most seductive exit in trading.
So when price finally climbs back to 500 — what must happen?
A wall of selling appears exactly there. Placed by memory. Executed with relief. Price hits it and stalls.
You've just built resistance from first principles. No geometry, no magic. Trapped humans, remembering.
Flip it for support: a zone where buyers were previously rewarded. Price returns and three crowds converge — winners wanting to repeat the winning trade, regretters who missed it last time and swore an oath, and whales who know both crowds exist. Their combined buying is the floor.
That's why this chapter is called scar tissue. A level is not a line on glass. It's the address of a wound — or a victory — in thousands of memories. The market remembers nothing; the people in it remember everything.
Everything practical falls out of that one idea:
Zones, not lines. A thousand people didn't buy at exactly 500.00 — they bought at 496, 503, 508. The memory is smeared across a band. Draw bands, and stop feeling betrayed when price pierces your line by half a percent before behaving. The line was always your simplification.
Touches add witnesses — up to a point. Every respected visit deepens the memory and attracts more orders next time. But each visit also consumes some of the waiting orders. A level tested five times in quick succession is often wearing out, not strengthening. Scar tissue heals.
Round numbers count for free. Nifty 25,000. A ₹1,000 stock. No trading history created those levels — human minds did, by anchoring orders, targets and stops on round figures. Enough people treating a number as special makes it special.
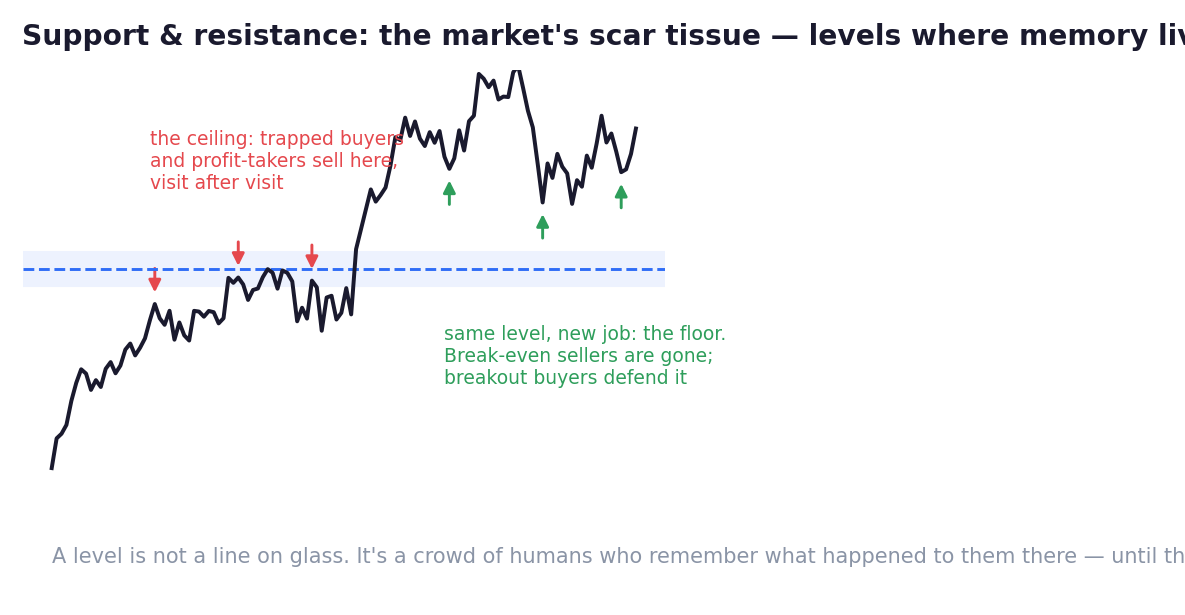
And the most elegant thing on any chart — role reversal. Watch the figure: a ceiling gets decisively broken... and on the next decline, the same level acts as a floor. Why would it?
Count the crowds. The trapped sellers who made the ceiling? They finally escaped in the breakout — their supply is gone. The breakout buyers? Their cost basis sits at that level; a return to it is where they defend. The ones who missed the move? They've been praying for a pullback to exactly there. Three crowds, all buying at the old ceiling. Old resistance becomes new support because the crowd standing at the level changed sides. The Playbooks called the retest 'the breakout shaking your hand'. Now you know whose hand.
One warning, and it's the whale chapter come back around:
The clearer the level, the better the bait. Obvious zones collect obvious stops just beyond them — and Chapter 02 taught you who's big enough to spring those stops and patient enough to want to. So a level is where you pay attention, never where you act blindly. What happens AT the level — the fight, the candles, the volume — is the actual information. That fight is exactly where this school is heading.
For now, take the prize this chapter came for. You've earned the first question of the checklist the intro promised — the question that deletes more bad trades than any indicator ever will:
Where is price standing — does memory live here, or is this the middle of nowhere?
No memory, no interest. The case never opens.
Key Takeaway
Levels are crowd memory: trapped buyers promising 'out at my price' build ceilings; rewarded buyers build floors. Draw zones, respect round numbers, and read role reversal as the crowd changing sides. The level is where you pay attention — the fight at it is the information. Checklist question #1: does memory live here?
Think About It
At what price are YOU currently the scar tissue — waiting to 'just get back to even'? Now that you know thousands wait there with you, what does this chapter predict will happen to price at that exact level?
Chart Lab — The Memory Map
Take one liquid stock you know well and a blank daily chart of the last year. No indicators.
Mark, as ZONES, the three or four areas where price clearly reversed or stalled repeatedly. For each, write the crowd's story: who is trapped here? Who won here? What is each group waiting to do?
Find one role reversal — a ceiling that later worked as a floor — and narrate it with the three crowds.
Then note the nearest zone above and below today's price. Don't trade them. Just watch the next visit live, and see whether the map you drew is the map others are trading. (Spoiler: mostly, it is. That's the point of shared memory.)