
A photographer shoots the same waterfall twice.
At 1/1000th of a second: every droplet frozen mid-air. Chaotic. Violent. Sharp.
With the shutter open 30 seconds: the same water melts into one smooth, silky ribbon.
Same waterfall. Two truths. Chosen by one setting — how long each frame collects light.
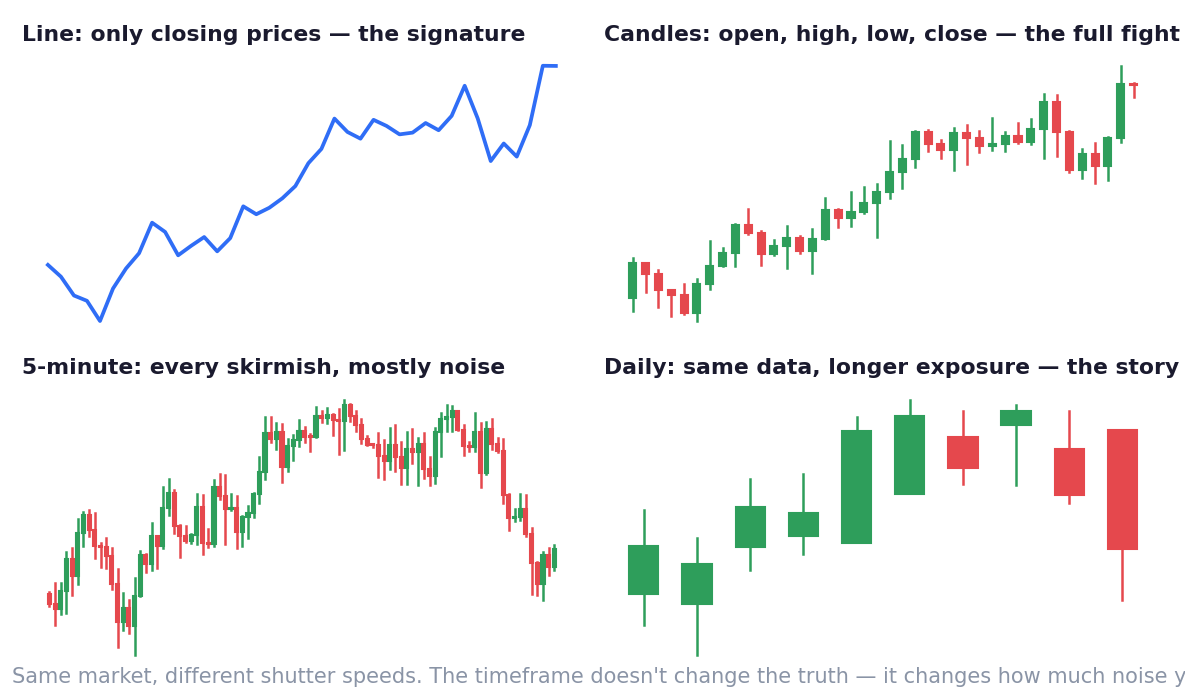
Your chart is that camera, and the timeframe is its shutter. A 5-minute chart packs five minutes of the fight into each frame; a daily chart, a whole session; a weekly, five sessions. Neither is 'more true'. They answer different questions — and the most common charting mistake alive is asking a droplet question at ribbon speed, or the reverse.
What each frame shows is the chart type. You need three, and only three:
The line chart keeps just the closing prices and throws away the rest. That sounds like weakness; it's a feature. The close is the day's signature — the price the market agreed to sleep on after the noise finished arguing. When you want only the big story, the line hides everything that doesn't matter.
The bar chart keeps four facts per frame — Open, High, Low, Close. Everything, minimal ink.
The candlestick keeps the same four facts but draws them so the psychology is visible from across the room: a fat body for the captured territory, coloured for the winner; thin wicks for the attacks that failed. Candles are bars with the fight made visible — which is why they conquered the world, and why they get the biggest chapter in this school (after you have your map and tide — the intro told you why: words need locations first).
Now the money rules, and there are only three:
Rule one: higher frame, heavier meaning. A weekly candle is the verdict of five full days of real money — crowd and whales included. The 'same' shape on a 1-minute chart is sixty seconds of twitching. Signals gain weight with the money and time compressed into them.
Rule two: match the shutter to your question. Holding for weeks? The daily and weekly charts are your instruments — the 5-minute chart is a torture device that will shake you out of good trades with meaningless wobbles. Trading intraday? The 5 and 15 are your workshop. Either way, pick your two frames — one for the big picture, one for the entry — and stop wandering.
Rule three: top-down, always. Map first, street view second. Professionals check the weekly for the tide, the daily for the wave, and only then zoom in for timing (next two chapters make this concrete). A 'perfect' 5-minute buy signal inside a daily downtrend is a well-timed ticket onto a sinking ship.
And one habit to kill before it forms, because it quietly bankrupts people:
Flipping through six timeframes until one agrees with the trade you already wanted is not analysis. It's shopping for permission. Decide your frames before you look — and let them say no when they need to.
Key Takeaway
A timeframe is a shutter speed: it changes which truth you see, not the truth. Closes are signatures; candles are the fight made visible; higher frames carry heavier verdicts. Pick two frames — map and street — read top-down, and never shop timeframes for permission.
Think About It
Which timeframe do you stare at all day — and does it match how long you actually hold? Or are you watching droplets while trying to trade the ribbon?
Chart Lab — One Stock, Three Shutters
Open the same recent period of one liquid stock in three shutters: weekly, daily, 15-minute.
Write one sentence per frame: what story does THIS one tell? Note where the stories agree — and where they flatly contradict.
Now commit, in writing, based on how long you actually hold trades: my map frame is ___, my street frame is ___.
Those two frames are yours for the rest of this school. Everyone else's are noise.