
Before you read a single candle, meet the two authors who write every chart on Earth.
Author one: the crowd. Millions of individual traders — you, Rahul, everyone's uncle. The crowd has three properties that matter:
- It runs on the ancient wiring the School of Market Psychology showed you — fear of loss, fear of missing out, the desperate love of break-even.
- Each member is small. One person's order moves nothing.
- But the crowd acts together — because it feels the same feelings at the same time, watching the same prices and the same news. A million small orders, synchronised by emotion, become one enormous force. The crowd doesn't decide to act together. It just does.
Author two: the institutions. Mutual funds, FIIs, insurance giants, prop desks — call them the whales. One whale managing thousands of crores has the opposite problem:
It is too big to trade.
Sit with that, because it's the most important sentence in this chapter. Suppose a fund wants to buy ₹500 crore of a stock that trades ₹40 crore a day. It cannot click 'buy'. There aren't enough sellers at today's price — its own order would send the price flying before a fraction was filled, and it would spend weeks buying its own echo at ever-worse prices.
So what does the whale actually do?
Go to any wholesale mandi and watch the biggest buyer work. He needs ten tonnes of onions. Does he announce it? Never — every farmer would double the price by lunch. He strolls. He buys a little here, a little there, from many sellers, over hours, at boring prices, looking faintly uninterested the whole time. By evening he owns his ten tonnes and the price barely moved.
That is institutional trading. Buying weeks' worth of supply in pieces, quietly, from many sellers, while looking uninterested. Traders call it accumulation. Selling works the same way in reverse — distribution — offloading into strength, slowly, while the crowd is excited enough to absorb it. (Hold those two words; the tide chapter arranges them in time.)
And now the idea that powers this entire school:
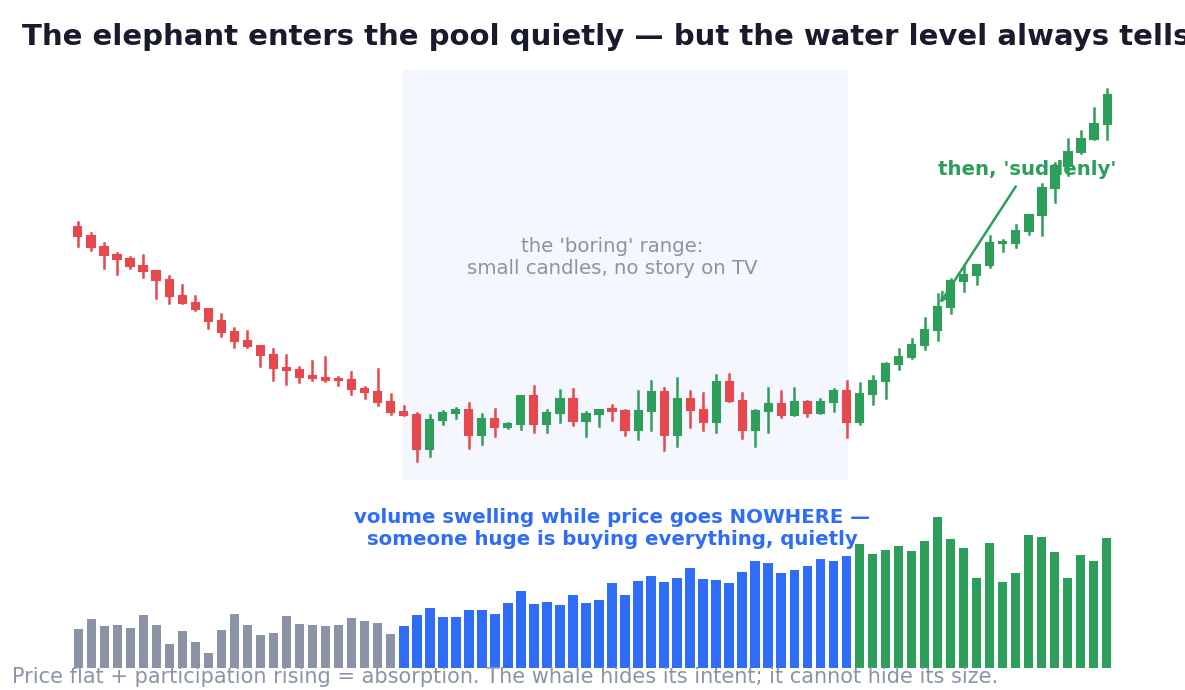
The elephant can hide its intentions. It cannot hide its size.
However quietly it slips into the pool, the water level rises. However cleverly the whale splits its orders, its trading leaves marks on the tape that a crowd's trading never could:
- A panic-fall that stops dead at one zone, day after day — because someone is buying everything thrown at it. (You'll see this as a wick in Ch 06.)
- A price that goes nowhere for weeks while trading activity quietly swells — enormous effort, zero movement, which is only possible if someone huge is absorbing. Look at the figure. The crowd finds that range boring. The boredom is manufactured.
- A level that everyone can see breaking — and then a violent poke through it that instantly reverses, because someone big harvested the stops resting there. (The Playbooks called it the stop hunt. Now you know the author.)
This is why we read charts at all. Not for shapes — for footprints. Retail footprints are light and everywhere: the FOMO spike, the panic dump, the break-even exit at the old high. Whale footprints are heavy and rare: absorption, the manufactured boring range, the level defended with unlimited patience.
Meera's entire read in Chapter 01 — "someone large has been buying every dip; you can see the dents" — was just this chapter, applied.
Two honest cautions before your checklist starts assembling:
Whales know you're tracking them. The obvious footprint at the obvious place is sometimes painted — bait for trackers. That's why this school will never let you act on one clue (a checklist is coming, one question per chapter).
And 'smart money' is not all-knowing money. Institutions misjudge constantly — they're just big, not psychic. We track their footprints because size moves markets, not because size is always right.
From here on, every tool in this school is a footprint-reader. Levels: where the crowd's memory lives. Candles: the round-by-round fight between the two authors. Volume: the water level of the pool. You now know who you're tracking.
Time to pick up the camera.
Key Takeaway
Every chart has two authors: a crowd synchronised by emotion, and whales too big to trade openly — so they buy like the mandi's biggest buyer: quietly, in pieces, looking bored. But size can't hide: absorption, manufactured boring ranges and defended zones are the footprints this whole school teaches you to read. Track the elephant by the water level.
Think About It
Think of the last stock you bought in excitement. Someone sold it to you at that exact moment — calmly, in size. Which author of the chart were you? And which was the seller?
Chart Lab — Find the Elephant
Open the daily chart of any large stock over the past year, with volume bars on.
Hunt for one stretch where price moved sideways in a 'boring' range for weeks — ideally after a decline — while volume stayed heavy or grew. Ask: if huge selling was clearly happening (the volume proves it), who was buying ALL of it without letting price fall?
Then find the opposite footprint: a euphoric, news-heavy top where price stalled sideways on massive volume before rolling over. Who was selling into that excitement, and to whom?
Write one line for each: 'The elephant was [entering/leaving] the pool here, because ___.'
You won't be certain — trackers never are. You're learning to notice water levels. Certainty was never on offer; evidence is.