
It's 9:20 on a Tuesday morning. Two traders open the exact same Nifty chart.
Rahul has spent six months on YouTube. He sees the chart and his memory starts firing: bullish engulfing... possible cup-and-handle... RSI at 62... a trendline if I tilt my head...
By 3:30 he has traded fourteen times. Paid brokerage fourteen times. Lost money.
Meera looks at the same screen and sees something completely different:
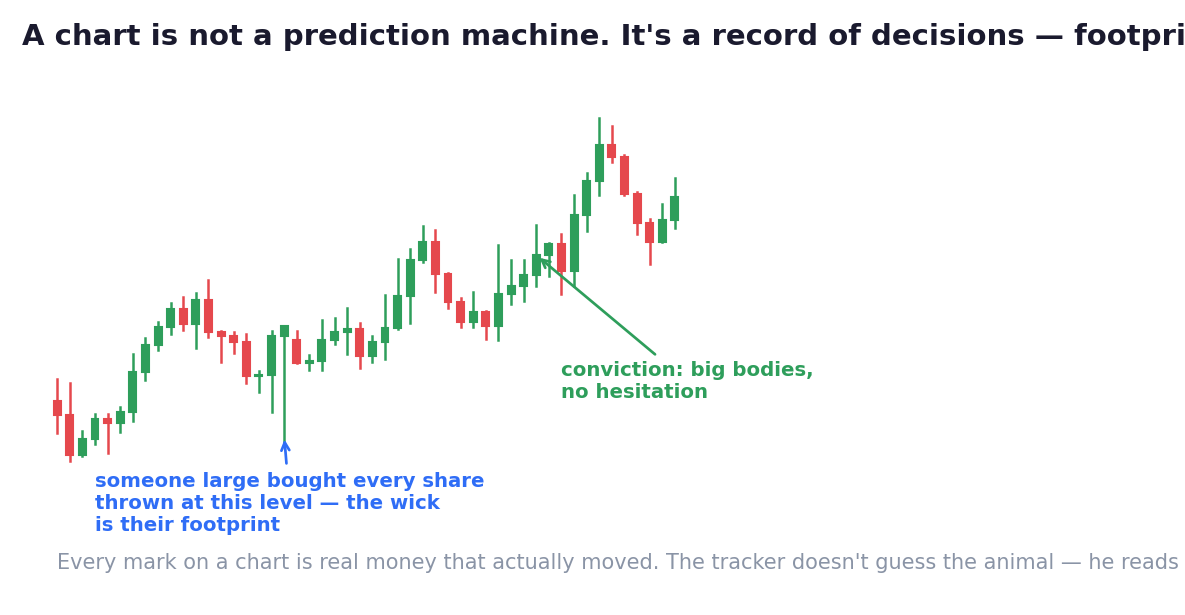
A crowd got trapped up there on Tuesday — they'll be selling with relief if price climbs back to their entry. Down here, someone very large has been quietly buying every dip for a week; you can see the dents they leave. And this morning's fall just slammed into their zone... and stopped.
One trade. Planned before entry. Done by 11:15.
Here's the uncomfortable part:
Meera doesn't know more patterns than Rahul. She knows almost none.
She knows the grammar — who is on the chart, where they're trapped, and what their footprints look like. The patterns Rahul memorised are just sentences in a language he never learned. She learned the language and never needed the flashcards.
Now, be honest about the world you're learning this in.
Technical analysis might be the single most-taught subject on the internet. Ten thousand channels, all teaching the same thing the same way: forty candle names. Twenty indicators. Memorise, apply, profit.
And it fails. Reliably. Usually within the first month of real money. Not because charts are useless — because memorising answers is not understanding the question. You've met this in school: the student who memorised solved examples scores well right up until the exam changes one number. Markets change the number every single day.
So this school makes you three promises, and it will keep all of them:
Promise one: you will not memorise a single pattern for its name. Names are labels on things you'll be able to read directly. By the candle chapter, you'll read formations you've never been taught — the way you can read a sentence you've never seen, because you know the words.
Promise two: every tool must explain itself. Nothing enters your toolkit without answering one question: why would this work — which humans, doing what, make it work? A level 'works' because specific people remember specific pain there. An indicator 'works' because it measures something real about the crowd. Anything that can't answer the question is decoration, and decoration costs money.
Promise three: location before everything. Here is the deepest idea in the whole school, and you'll meet it again and again:
Shout *"Fire!"* in a kitchen, and it means dinner is ready.
Shout *"Fire!"* in a crowded cinema, and it means run.
The word never changed. The location is the meaning. Every candle, every signal, every pattern is a word. Where it's spoken decides what it says. Rahul trades words. Meera trades words in places — and that single difference is most of the gap between them.
One more thing before the roadmap, because it reframes everything:
A chart is not a prediction machine, and staring at it harder won't reveal the future. A chart is a diary — a second-by-second record of every decision, every fear, every burst of greed, written by the participants themselves. And it's the one document in markets where nobody can lie, because to write in it, you must actually trade. Every mark cost someone real money.
We don't read that diary to predict. We read it the way a tracker reads footprints in snow: for evidence — of who passed, how big they were, whether they were running, and who's likely still nearby. Probabilities, never certainties. Anyone selling you certainty is selling you Rahul's six months.
The roadmap, so you can see the design:
First the cast — the two kinds of players who write the diary, and why the big one can never fully hide (Ch 02). Then your camera — charts and timeframes (Ch 03). Then the map — where crowd memory lives (Ch 04) — and the tide — which way the ocean is moving (Ch 05). Only THEN candles (Ch 06), because a candle only means something somewhere. Then the lie detector (volume, Ch 07) and two honest lenses (Ch 08–09). And as you go, you'll collect the four questions of a checklist, one per chapter — assembled in Ch 10 and put on trial with your own data in Ch 11.
By the end, you'll look at Rahul's chart and see Meera's.
Same chart. New eyes. Let's build them.
Key Takeaway
Patterns are sentences; most courses teach you to memorise sentences without the language. This school teaches the grammar: who writes the chart, where they're trapped, what their footprints look like — and the rule above all rules: 'Fire!' means dinner in a kitchen and run in a cinema. The word never changes. The location is the meaning.
Think About It
Be honest: when you look at a chart today, do you see shapes you've memorised — or people making decisions? Which trader from this chapter have you been?
Chart Lab — Rahul's Eyes, Meera's Eyes
Open any daily chart of a liquid stock. Set a timer for two minutes and write down everything you see — freely, no rules. That's your 'before' photo.
Now answer only these, using yesterday's candle and the last month:
No pattern names allowed. Only people, money and hope.
Keep the 'before' note. On the last day of this school, repeat the exercise on a fresh chart and compare. The distance between the two notes is what this school built.