
Throw a ball straight up and watch closely.
Long before it reverses — while still rising — something measurable happens:
It slows.
Gravity never flips a ball's direction in one instant. It kills the speed first. Deceleration comes before every turn, by law.
Crowds have their own version of that law, and you already know its mechanism from the Psychology school: a rally is a machine that consumes its own fuel. Every burst upward uses up the willing buyers at those prices; the top forms when the last excited buyer has bought. So moves usually lose speed before they lose direction — drifting on momentum and hope after the aggression is spent.
Price shows you the ball's height. Wouldn't you also like an instrument for its speed?
That's what oscillators are. Chapter 08's averages smooth position; oscillators measure momentum — and the most famous one was built in 1978 by an engineer-turned-trader named J. Welles Wilder, in a book that handed the world half its modern toolbox in one go. His speedometer: the Relative Strength Index — RSI.
Run it through Chapter 08's master key. What does the lens focus on? In plain words: over the last 14 rounds, how one-sided has the trading been? It weighs the up-moves against the down-moves and squeezes the answer onto a 0–100 dial. Near 50: balanced. Above 70: the recent action has been overwhelmingly one-way up — the engine running hot; the dial says overbought. Below 30: overwhelmingly down; oversold.
Why does that matter to the humans making prices? Because one-sidedness is a fuel gauge: an extremely one-sided burst means the aggressive side has been spending its buyers (or sellers) at a furious rate — and Psychology already told you what happens when the crowd's last participant acts.
Now — the two words 'overbought' and 'oversold' have probably cost retail India more money than any other two words on a screen, so let's fix them permanently:
Overbought does NOT mean 'sell now'. It means exactly one thing: the recent move was unusually fast and one-sided. A speedometer reading. Not a verdict.
And here's why the distinction is worth a whole chapter — a hot engine means opposite things in two regimes, and you've already trained in both:
On the ping-pong table (range days — most days), speed is unsustainable. A violent one-way burst inside a range has stretched away from fair value on no new information; the aggressive buyers are spent; the rubber-band snap toward the middle is the high-probability event. Here, OB/OS zones genuinely mark the watch-areas for mean reversion. This is the science behind fading the zones: the burst consumed its own fuel, and the gauge just told you so.
On the travelator (trend days, real trends), a hot engine is called a strong engine. Powerful uptrends pin RSI above 70 for weeks while price climbs relentlessly — because fresh fuel keeps arriving: new money, new news, trapped shorts forced to buy. Selling every 'overbought' print in a trend is the leash-on-a-running-owner mistake — one of the fastest documented ways to donate a month of profits. In a trend, overbought describes strength. It prophesies nothing.
Same dial. Opposite meanings. The regime decides — which is why the Playbooks' founding rule (name the day first) comes before reading any oscillator, forever. An oscillator without a regime is a speedometer with no road.
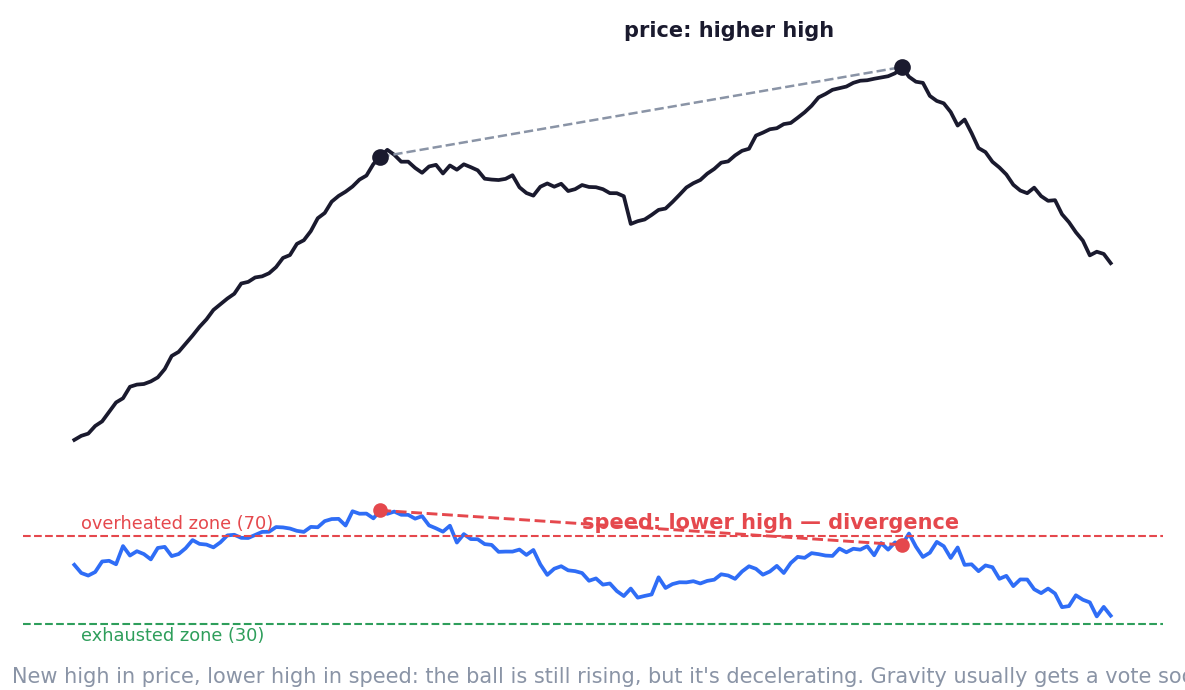
And now the reading Wilder prized most — the ball slowing mid-air, made visible: divergence.
Look at the figure. Price grinds out a new high; everyone watching height celebrates. But the speedometer disagrees: RSI's second peak is lower than its first. The new high was reached with less force — fewer aggressive buyers, weaker one-sidedness. Height up. Speed down.
The ball is still rising. And it has started to slow.
That's bearish divergence: the engine dying while the car coasts forward on momentum. Mirror it at the lows for the bullish version — price makes a lower low, but the ferocity of the selling visibly fades: the panic is running out of panickers.
Two disciplines, or this chapter will cost you money instead of making it:
Divergence is an early warning, never a trigger. Speed can fade and then refuel — divergences fail routinely in strong trends, and 'the ball must fall NOW' has bankrupted impatient shorts for fifty years. A divergence earns exactly one thing: a seat as a supporting witness — it tells you to pay attention at your level, tighten risk, watch the fight. Alone, it convicts nobody.
And the master key retires the rest of the menu. MACD — the other famous oscillator — is simply the gap between two moving averages, plotted: a lens on whether the tide is accelerating or tiring. Stochastics, ROC, the cousins: variations on the same single question — how fast, and is the speed changing? You don't need six speedometers on one dashboard. You need one, read with regime awareness — and the humility to remember what it measures.
Height is what everyone watches.
Speed is where the warnings live.
Key Takeaway
Oscillators measure speed, not worth: RSI reads how one-sided recent trading was — a fuel gauge on the crowd. Overbought means fast, not sell: fade it on the ping-pong table, respect it on the travelator; the regime decides, always. Divergence is deceleration before the turn — an early warning and a supporting witness, never a verdict alone.
Think About It
Have you ever shorted purely because RSI crossed 70? Now answer the question you skipped that day: what kind of day was it — the table, or the travelator?
Chart Lab — The Speed Check
RSI (14) under daily Nifty, one year back. Find and label:
Then write the regime rule in your own words and pin it above your screen: 'Before I read speed, I name the day.' That sentence is worth more than the indicator.