
THE THEORIST
Who
Louis Bachelier (1870–1946), French mathematician — the pioneer; Burton Malkiel (b. 1932), Princeton economist — the populariser; Benoit Mandelbrot (1924–2010) — the great amender
When & where
Paris 1900 (Bachelier's thesis, ignored for decades); Princeton 1973 (Malkiel's bestseller)
Why they built it
Bachelier wanted the mathematics of price movements and found chance at the core. Malkiel, after Wall Street years, wanted the public to know what the data showed about 'expert' stock-picking
The work
Bachelier, 'The Theory of Speculation' (1900); Malkiel, 'A Random Walk Down Wall Street' (1973 — still updated and in print)
The famous line
Malkiel: a blindfolded monkey throwing darts at the stock listings could select a portfolio that does as well as the experts'
Portrait sourcing
Bachelier: public domain. Malkiel & Mandelbrot: Wikimedia Commons (CC-licensed)
Picture a man leaving a bar, deeply drunk, holding a lamppost.
He lets go and starts walking. Each step is a stagger in a random direction — left, right, forward, back. No plan, no memory, no destination.
Now here's the strange part: if you trace his path on paper, it doesn't look random. It looks like it has intent — long runs in one direction, sudden reversals, hesitations at invisible walls. Our pattern-hungry brains (the same wiring that finds faces in clouds) can't help seeing a story in the stagger.
Random Walk Theory is the claim that stock charts are the drunkard's path — and that most of what chartists 'see' in them is the face in the cloud.
The theory has two fathers, seventy years apart. Louis Bachelier, a French mathematician, worked it out in 1900 — modelling prices as accumulating random steps, five years before Einstein used similar mathematics for physics — and was ignored by finance for two generations. Burton Malkiel, a Princeton professor who had actually worked on Wall Street, resurrected the idea for the public in 1973 with one of the best-selling investment books ever written, and one of the most quoted sentences: a blindfolded monkey throwing darts at the newspaper's stock listings could pick a portfolio that performs about as well as the professionals'.
(People kept testing the monkey claim with dart-throwing contests and random portfolios. The monkeys held up embarrassingly well.)
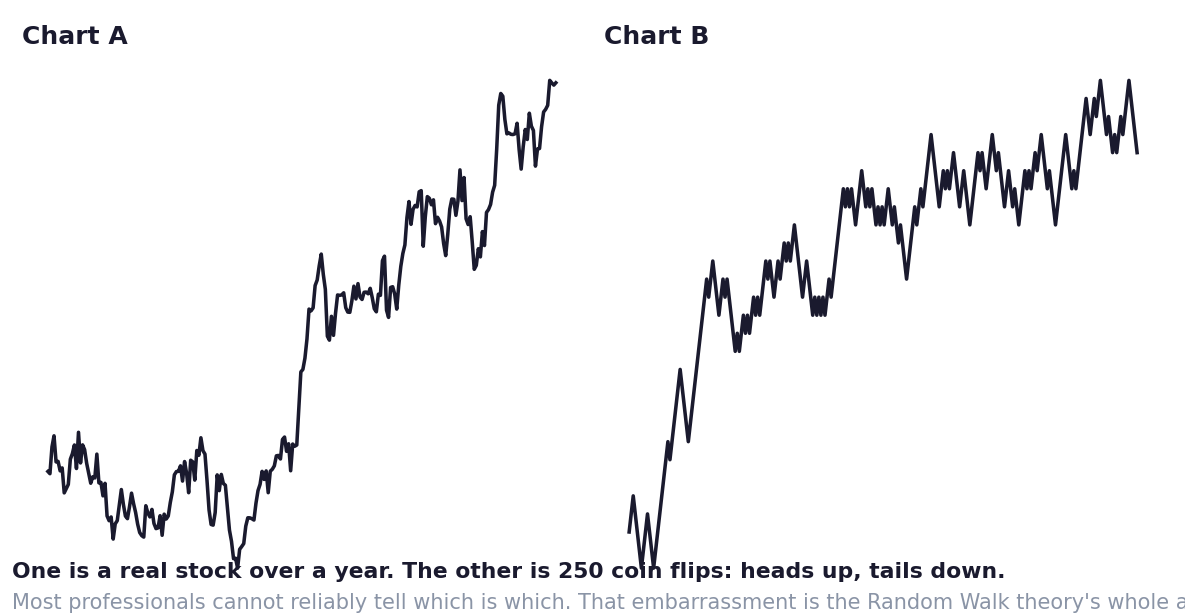
Before you argue with the theory, sit with its most famous classroom demonstration — the one in this chapter's figure:
A professor gives students a coin. Heads, an imaginary stock rises a step; tails, it falls a step. They flip 250 times and draw the 'chart'. The result has everything a technician loves: trends, support levels, breakouts, a beautiful 'head and shoulders'. Chartists shown such coin-charts have famously gotten excited and issued strong recommendations.
It was a coin. There were no trends. No support. No pattern. Only chance — and a human brain determined to find meaning in it.
That's the theory's real gift, and it has nothing to do with whether markets are perfectly random (they're not — hold on). The gift is a piece of statistical humility every investor desperately needs:
Pure chance produces streaks, trends and patterns that look exactly like skill and meaning. Ten thousand fund managers flipping coins will produce a few dozen with dazzling five-year records — and they'll all write books. A stock that rose six days straight requires no explanation at all; coins do that constantly. Before you honour any pattern — on a chart, in a track record, in your own last month — first ask the drunkard's question: could chance alone have drawn this? The answer, humblingly often, is yes.
Why would prices walk randomly? Chapter 3 already told you: if information is priced almost instantly (EMH), then today's price already contains everything known — so tomorrow's move can only come from tomorrow's news, which is, by definition, unpredictable today. Random Walk is EMH's statistical shadow: same elephant, touched with a calculator instead of a theory.
Now, the honest cracks — because this hand is not the whole animal either:
The walk isn't perfectly random. Decades of careful research found small but real regularities: momentum (winners drifting on), sharp reversals after panics, calendar quirks that came and went. Small edges — mostly tiny after costs, and shrinking once published (the market reads its own research, remember).
And the steps aren't well-behaved. The mathematician Benoit Mandelbrot delivered the deepest correction: real markets produce extreme days — crashes and melt-ups — vastly more often than the polite bell-curve randomness of a drunkard's stagger would ever allow. The walk is random-ish, but with fat tails: the drunkard occasionally teleports. Anyone who sized their risk assuming gentle randomness discovered this in 1987, 2008 and 2020. (The School of Market History is a museum of exactly those teleports.)
How to use the lens, practically:
Treat it as your default scepticism setting. Patterns, streaks and star track-records are guilty until proven innocent — because chance fakes all three fluently. Demand large samples before believing anything (a coin can't fake 200 trades as easily as it fakes 10). And respect the fat tails: whatever your strategy, size it for the teleport, not the stagger.
The drunkard, it turns out, is a wonderful teacher.
He just occasionally gets hit by a bus.
Key Takeaway
Prices move like a drunkard's walk because today's price already contains today's knowledge — and chance fluently fakes trends, patterns and star track-records. Use it as your default scepticism: demand big samples, ask 'could a coin have drawn this?', and heed Mandelbrot's correction — the walk has fat tails, so size your risk for the teleport, not the stagger.
Think About It
Think of a pattern or a hot streak you currently believe in — a setup, a fund, your own last twenty trades. Honestly: how many coin-flips of evidence is it actually standing on?
Theory Lab — The Coin Chart
Do the professor's experiment yourself — it takes ten minutes and vaccinates you for life.
Flip a coin 100 times (or use a random generator). Heads: +1, tails: −1. Plot the running total as a 'price chart'.
Now study your creation like a chartist: mark the 'trend', the 'support level', the 'breakout'. Notice how real they look — and how strongly your brain wants to trade them.
Then write the sentence this lab exists for, and keep it: "Chance drew this. Chance can draw anything. What would convince me a real pattern ISN'T chance?"
Your answer to that last question — usually 'a much bigger sample than I've been using' — is the theory, installed.