
THE THEORIST
Who
Daniel Kahneman (1934–2024) & Amos Tversky (1937–1996), Israeli-American psychologists — one of the great intellectual partnerships of the 20th century
When & where
Jerusalem & Stanford through the 1970s; the landmark paper, 1979
Why they built it
Economics assumed humans decide rationally. Kahneman & Tversky — psychologists, outsiders — simply TESTED how real people choose under risk, with experiments. Real people broke every assumption, in consistent, predictable ways
The work
'Prospect Theory: An Analysis of Decision under Risk', Econometrica, 1979 — one of the most cited papers in all of social science; Kahneman's book 'Thinking, Fast and Slow' (2011) made it world-famous
Recognition
Nobel Prize 2002 to Kahneman (Tversky had died in 1996; prizes aren't given posthumously — Kahneman said it belonged to them both). Richard Thaler, who carried the ideas into finance, won in 2017
Portrait sourcing
Wikimedia Commons: 'Daniel Kahneman', 'Amos Tversky' (CC-licensed)
Try this on yourself before reading further. A stranger offers you a coin flip:
Heads, you win $150. Tails, you lose $100.
Take it?
Mathematically, it's a wonderful bet — on average you make $25 per flip. Any calculator says yes. Yet when researchers offer it to real people, most refuse. The possible loss of $100 somehow outweighs the bigger possible gain.
For two hundred years, economics had a simple answer to this: those people are being irrational, and irrationality is random noise that cancels out. Markets, built from many people, would behave rationally.
Then two psychologists decided to actually measure how deciding feels.
Daniel Kahneman and Amos Tversky were an odd couple — Kahneman doubting and careful, Tversky brilliant and fearless — who spent the 1970s walking around asking people carefully designed questions about risky choices, and writing down what humans actually do. Their 1979 paper didn't argue that people are irrational.
It showed something far more useful: people are irrational in consistent, predictable, measurable ways. Not noise. Wiring.
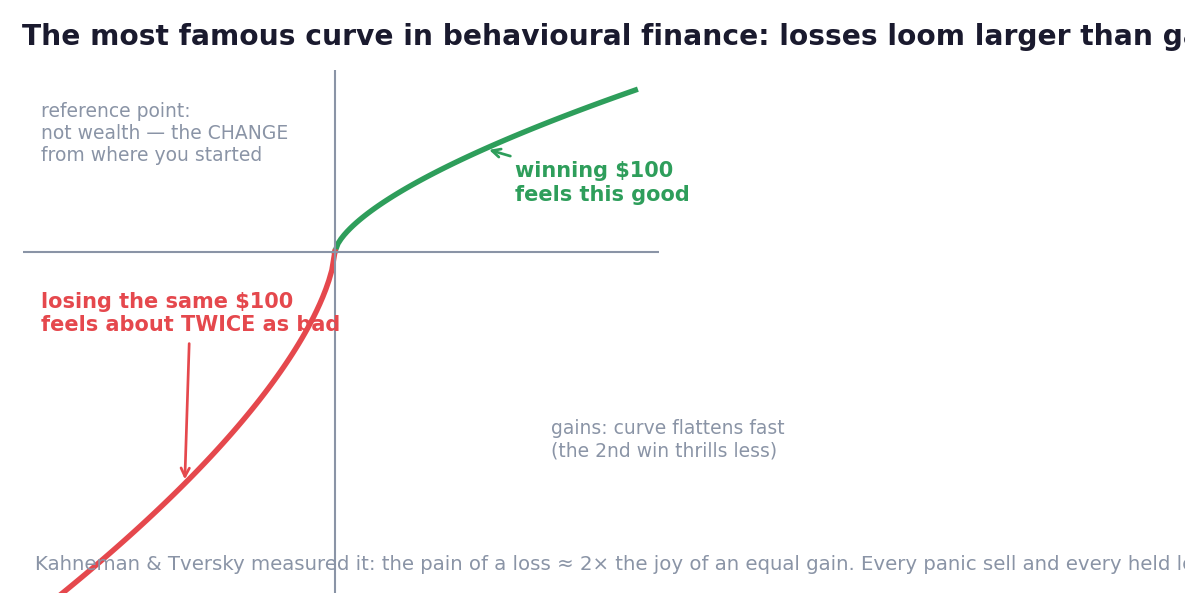
Three findings matter most for anyone who touches markets. Look at the famous curve in the figure as you read — it's the whole theory in one picture.
Finding one — losses loom larger than gains. Winning $100 feels good. Losing $100 feels bad. But not equally: the pain of the loss is roughly twice the intensity of the joy of the gain. That single asymmetry — loss aversion — is why people refuse wonderful coin flips. And it is, without much exaggeration, the engine room of trading failure: it powers the panic sell (escaping pain now), the refusal to take a small planned loss (locking in pain), and the paralysis at bottoms (when acting means feeling the loss).
Finding two — you don't feel wealth; you feel change. People don't experience 'I have $50,000.' They experience 'I'm down $3,000 from last month.' Everything is measured from a reference point — usually your purchase price, or your account's recent peak. This is why the same portfolio value feels like triumph to one person and disaster to another, and why 'getting back to even' exerts such gravitational pull: even isn't a number, it's the border between two feelings.
Finding three — the curve flips your risk appetite, exactly backwards. Look at the shape again: it flattens on both sides as you move outward. In the gains region, that flattening makes you risk-averse — a sure profit feels better than gambling for more, so you snatch winners early. In the losses region, the same flattening makes you risk-SEEKING — a sure loss feels unbearable, so you gamble to avoid making it real: you hold the loser, average down, 'give it time'.
Put finding three in one sentence and you have the most expensive habit in retail trading, documented in brokerage data across many countries (researchers call it the disposition effect):
People sell their winners quickly and hold their losers indefinitely — pruning the flowers and watering the weeds. Not because they're foolish. Because the curve makes it feel right, every single time.
This chapter is the direct rebellion against Chapter 3's elephant-part. EMH said prices absorb information rationally; Kahneman and Tversky proved the humans doing the absorbing run on a bent curve — and Richard Thaler and others then showed those bends surviving in market prices themselves: bubbles, panics, overreactions. The 2002 and 2017 Nobels made the rebellion official. (And remember the elegant 2013 committee joke: Fama and Shiller, sharing a prize. Both hands. One elephant.)
Now the practical part — and it starts with the most important warning in behavioural finance:
Knowing the theory does not switch off the wiring. Kahneman himself said decades of studying biases barely improved his own. You cannot out-think a feeling in the moment; the curve is older than language. What you can do is what every profession does with known human limits:
*Build systems that decide before the feeling arrives.*
- Decide exits at entry. Your stop-loss and target, written before you're in the trade, are decisions made by pre-curve you — the only version of you the curve can't reach. In the trade, you don't decide. You obey the note.
- Automate what recurs. Standing monthly investments, automatic rebalancing (Chapter 5's calendar): machines don't have reference points.
- Audit for the disposition effect. Your trading history will show it in minutes: average holding time of winners vs losers. Most people find the losers held several times longer. That number IS your curve, printed.
- Re-frame the reference point. 'Down 12% from the peak' and 'up 40% from purchase' can describe the same position. Choose reference points deliberately, or your app will choose them for you — in red.
The curve isn't a flaw to be ashamed of. It kept your ancestors alive: the one who over-feared losses out-survived the one who shrugged at them.
It just never met a stop-loss order.
So you'll have to introduce them.
Key Takeaway
Kahneman & Tversky measured how deciding feels: losses hurt ~2× equal gains, everything is felt relative to a reference point, and the curve makes you risk-shy with winners and risk-hungry with losers — the disposition effect. Knowing it doesn't cure it: build systems that decide before feelings arrive — exits at entry, automation, and an audit of how long you hold losers vs winners.
Think About It
Open your trading history and estimate: how long do you hold losers compared to winners? If losers live several times longer — whose decision was that, yours or the curve's?
Theory Lab — Print Your Curve
Pull your last 20 closed trades (any market, any size).
Compute two numbers: average days held for winners, and for losers. Write the ratio.
Then find your three fastest exits and three longest holds. For each, one honest line: what was I feeling at the reference point — protecting a joy, or postponing a pain?
Finish with one system, installed today, that decides before the feeling arrives — a written exit on every open position is the classic. Not because you're weak. Because the curve is two million years old, and it doesn't read theory chapters.