
THE THEORIST
Who
Ralph Nelson Elliott (1871–1948), American accountant and business consultant
When & where
California, 1930s — retired and gravely ill in his sixties, he turned to studying decades of market charts as, essentially, a convalescence project
Why he built it
The 1929 crash (see the School of Market History) had made 'the market is chaos' the fashionable view. Elliott, an accountant to his bones, refused to accept unaudited chaos — and went looking for the ledger's hidden order
The work
'The Wave Principle' (1938); popularised decades later by Robert Prechter, whose celebrated calls in the 1980s made the theory world-famous
The claim
Crowd psychology moves in a repeating rhythm: five waves with the trend, three against — and the pattern nests inside itself at every timeframe, with wave sizes often relating through Fibonacci ratios
Portrait sourcing
Public domain / Wikimedia Commons: 'Ralph Nelson Elliott' (pre-1948 photographs)
Every theory answers its moment. This one answered despair.
After 1929, the fashionable view was that markets were pure chaos — a casino wired to a madhouse. Ralph Nelson Elliott was uniquely unqualified and uniquely perfect to disagree: not a professor, not a trader, but a retired accountant — a man whose entire professional soul rebelled against the idea of numbers that don't reconcile.
In his sixties, gravely ill and confined for long stretches, Elliott took on a convalescence project of magnificent stubbornness: he collected some seventy-five years of market charts, from yearly sweeps down to half-hourly wiggles, and audited them like suspect books, looking for the hidden order.
In 1938, aged 67, he published his conclusion — and it was grander than anyone expected:
The market is not chaos. It is a natural rhythm of crowd psychology — and it moves in waves you can count.
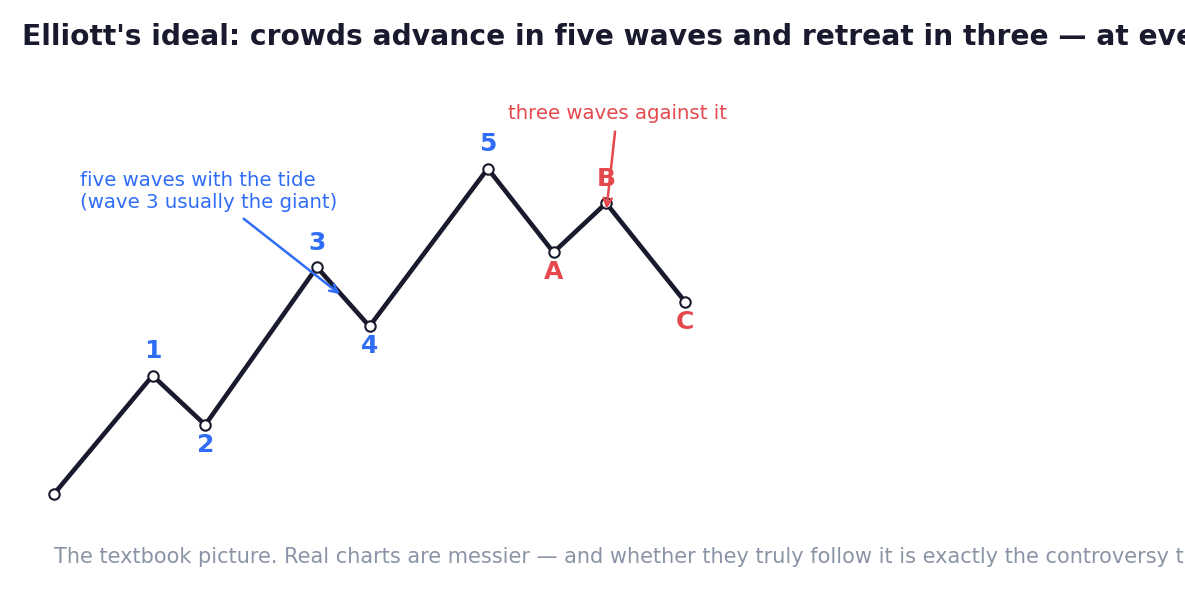
The pattern he claimed (the figure shows the textbook ideal): a trend advances in five waves — three pushes forward (1, 3, 5) separated by two pullbacks (2, 4) — then retreats in three waves (A, B, C). Five forward, three back. And the psychology of each wave is wonderfully human:
Wave 1 rises in disbelief (nobody trusts it). Wave 2 retraces and 'proves the doubters right' — without breaking the low. Wave 3 is the giant: the crowd finally believes, and belief arrives all at once — typically the longest, most powerful stretch. Wave 4 is the bored consolidation. Wave 5 is the euphoric last push — weaker inside than it looks, running on the last arriving optimists (you've met them in every school). Then A-B-C: the first real break, the false hope, the capitulation.
If that arc sounds familiar, it should — it's Dow's tide (Chapter 2) with the crowd's emotional biography written onto each wave, and it rhymes with the accumulation-to-distribution cycle you may know from technical study.
Elliott then added the two claims that made his theory famous — and controversial:
The waves nest. Each wave, examined closely, is built of smaller waves of the same shape, which are built of smaller ones still — the same pattern at every timeframe, decades down to minutes. (Mathematics later gave this property a name — fractal — and Mandelbrot, the fat-tails man from Chapter 4, agreed markets are fractal even while doubting the countable waves.)
And the waves keep proportions. Elliott found wave sizes often relating through the Fibonacci ratios — nature's recurring proportions — which lent the theory an almost mystical glamour: the market as a natural phenomenon, like a seashell or a fern.
So: profound insight, or beautiful pattern-matching on a drunkard's walk? Here this school owes you both hands of the argument, honestly.
The case for: crowd emotion genuinely does move in surges and exhaustions, not straight lines — and Elliott's psychological arc (disbelief → belief → euphoria → denial → capitulation) describes real manias and busts uncannily well. Some practitioners, most famously Robert Prechter in the 1980s, produced celebrated market calls with it. As a map of crowd mood, the five-three rhythm has real descriptive power.
The case against — and it's serious: the theory is extraordinarily flexible. Waves can extend, truncate, and nest; when a count fails, it can be recounted. Critics note that two skilled Elliott analysts can read the same chart into opposite forecasts — and Chapter 4 taught you how eagerly the human brain finds patterns in randomness. A theory that can explain any outcome after the fact is, scientifically speaking, very hard to ever prove wrong — which is precisely why it remains a 'theory' beloved by practitioners and doubted by academics.
Both hands are touching something true. So how do you use this lens without being used by it?
Use the psychology, loosely; distrust the precision. The durable value is the emotional arc: knowing that third waves (belief arriving) run furthest, that fifth waves (euphoria) are weaker than they look, that the sharpest countertrend rally (B) is the trap. Those insights improve your reading of any trend — no ruler required.
Never trade a count alone. If you use wave analysis, treat it as ONE witness that must agree with structure, levels and participation — never as a private prophecy. The moment a count requires 'recounting' to survive, it has told you something: mostly about you.
And run it through Chapter 12's court like everything else: if wave-based entries genuinely help, your own tagged results will show it within fifty trades. The accountant would approve. Audit the auditor.
Key Takeaway
Elliott, an ailing accountant auditing 75 years of charts, claimed crowds advance in five waves and retreat in three, nested at every scale. Keep the durable part — the emotional arc (disbelief, belief, euphoria, denial, capitulation; third waves run furthest, fifth waves flatter to deceive) — and defend against the famous flaw: counts flexible enough to explain anything must never be traded alone, and must face your own ledger like every other lens.
Think About It
When you look back at the last big boom-and-bust you personally watched: can you name its disbelief phase, its belief phase, its euphoria, its false hope? If the arc fits so well backwards — what would it take to trust it forwards?
Theory Lab — The Emotional Count
Take a famous completed cycle — any major boom and bust you remember (an index, a stock, a crypto).
Without rulers or Fibonacci tools, label it ONLY with emotions: where was disbelief? Where did belief arrive in a rush (the candidate 'wave 3')? Where was euphoria (the candidate 'wave 5')? The false hope? The capitulation?
Notice two things honestly: how naturally the arc fits — and how many DIFFERENT ways you could have drawn the exact boundaries.
Both observations are the theory: real rhythm, unreliable ruler. Write one sentence on how you'd let Elliott inform your reading without ever letting a count, alone, place your money.