
THE THEORIST
Who
Charles Henry Dow (1851–1902), American journalist
When & where
New York, 1880s–1902 — his ideas appeared as newspaper editorials, never a book
Why he built it
He co-founded Dow Jones & Co. and created the industrial stock average (1896) as a JOURNALISM tool — one number for 'what did the market do today?' Watching that number daily, he saw structure in its movement
The work
Wall Street Journal editorials; assembled after his death by followers — notably Robert Rhea's 'The Dow Theory' (1932)
Portrait sourcing
Public domain (pre-1928 photographs) — Wikimedia Commons: 'Charles Henry Dow'
Every theory in this school was built by a person, in a moment, for a reason. Remember that rule — it makes every chapter easier.
The person: Charles Dow, a quiet, serious American journalist. The moment: the 1880s and 90s, when the stock market was a chaotic roar of individual stocks and nobody could answer a simple question — how did the market, as a whole, do today?
The reason: Dow was a newsman. He wanted to report the market like weather. So in 1896 he did something nobody had done: he averaged a handful of big industrial stocks into one number and printed it daily. The stock index — the ancestor of every index on Earth, whatever country you're reading this in — was born as a journalism tool.
And then something wonderful happened. Watching his own number, day after day, year after year, Dow noticed it didn't move like dice.
It moved like an ocean.
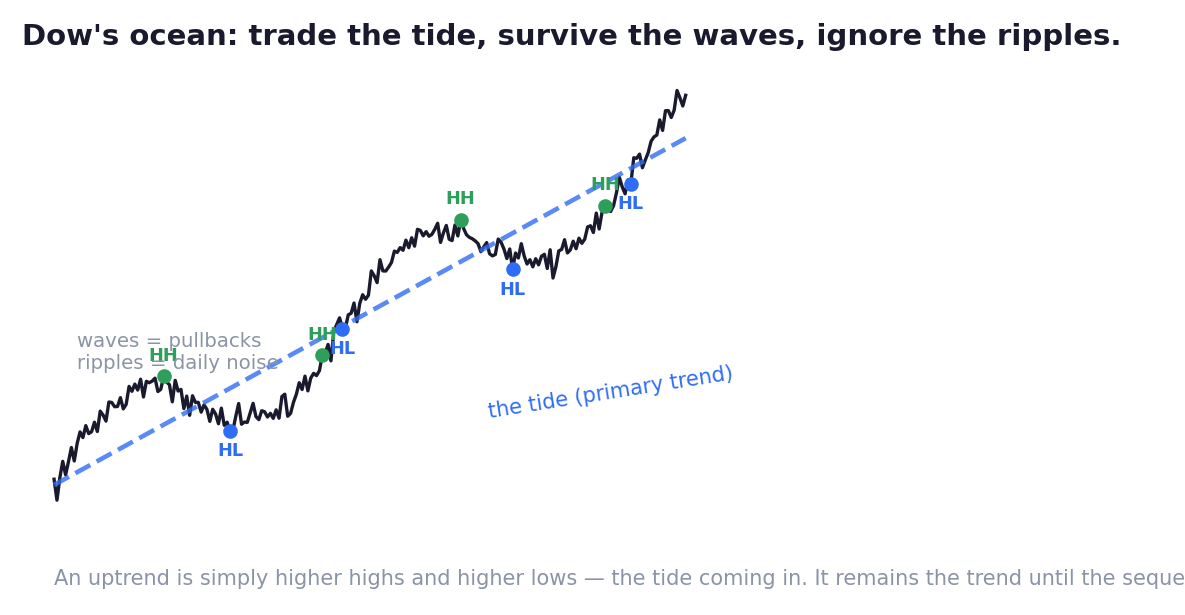
- A tide — one great direction, running for months or years. He called it the primary trend.
- Waves — pullbacks rolling against the tide for weeks, frightening everyone, changing nothing.
- Ripples — the daily jiggle, meaningful to almost no one.
Anyone at a beach can describe the ripples. But only a patient observer — watching where each successive wave reaches on the sand — can tell whether the tide is coming in or going out.
That observation became the most durable definition in all of finance, simple enough to write on your hand:
The tide is coming in when each wave reaches higher than the last, and each retreat stops short of the last one. Higher highs, higher lows: an uptrend. The mirror image — lower highs, lower lows — and the tide is going out.
No indicator. No formula. A pencil and honesty.
Dow died in 1902 without writing a book; followers stitched his editorials into 'Dow Theory' afterward. Three of its ideas have survived a century of markets, and they're the three you should carry:
One — know which layer your money lives in. Most losses in trending markets come from layer confusion: panic-selling a healthy tide because one wave rolled back, or agonising over ripples on a position meant to ride the tide for a year. Before any decision, ask: is this news a tide event, a wave event, or a ripple? The answer usually answers everything.
Two — the trend is innocent until proven guilty. Dow's most protective rule: assume the tide continues until the structure itself breaks — until an uptrend actually prints a lower high AND a lower low. Not when it 'feels stretched'. Not when a television expert calls the top. Enormous amounts of money are lost in the gap between it feels finished and the structure actually broke. Dow closes that gap with a rule a child can check.
Three — moves need confirmation. In Dow's day this meant two indices agreeing (if industry is booming, the companies transporting the goods should boom too — a lie detector built from logic). The specific test aged; the principle didn't: one signal, one chart, one source is a witness, never a verdict.
Where does the lens break? Dow himself was honest about it: the theory identifies tides late — only after a new structure is visible — and it says nothing about tomorrow or next week. It's a map of the ocean, not a weather forecast for Tuesday.
But as the first hand ever laid on the elephant, it grabbed something real that every later theory had to respect: markets move in persistent, structured trends far more than pure chance would allow — a claim so strong that, sixty years later, an entire academic movement (Chapter 3) was built partly to attack it.
That fight is next.
Key Takeaway
Dow, a journalist, invented the index to report markets like weather — then saw his number move like an ocean: tide, waves, ripples. Use his three survivors: know which layer your money lives in, treat trends as innocent until structure actually breaks, and never convict on one witness. A map of the ocean — not a forecast for Tuesday.
Think About It
The last time you sold in fear or bought in excitement — was it a tide event, a wave event, or a ripple? If you can't say, which layer was actually making your decisions?
Theory Lab — Find the Tide
Open a weekly chart of your country's main stock index, three years back. No indicators.
Mark every significant swing high and swing low with a pencil. Trace the sequence: where were higher highs and higher lows intact? Where did the structure genuinely break — a lower high followed by a lower low?
Count two numbers: how many times the structure ACTUALLY broke, versus how many times a scary wave made it feel broken.
That ratio — usually something like one real break to five scares — is Dow Theory's entire gift to your account. Write it at the top of the chart and keep the screenshot.