
THE DAMAGE
When
Peak January 2008; bottom March 2009; Lehman collapse September 15, 2008
Where
Everywhere — the point of this file
The fall
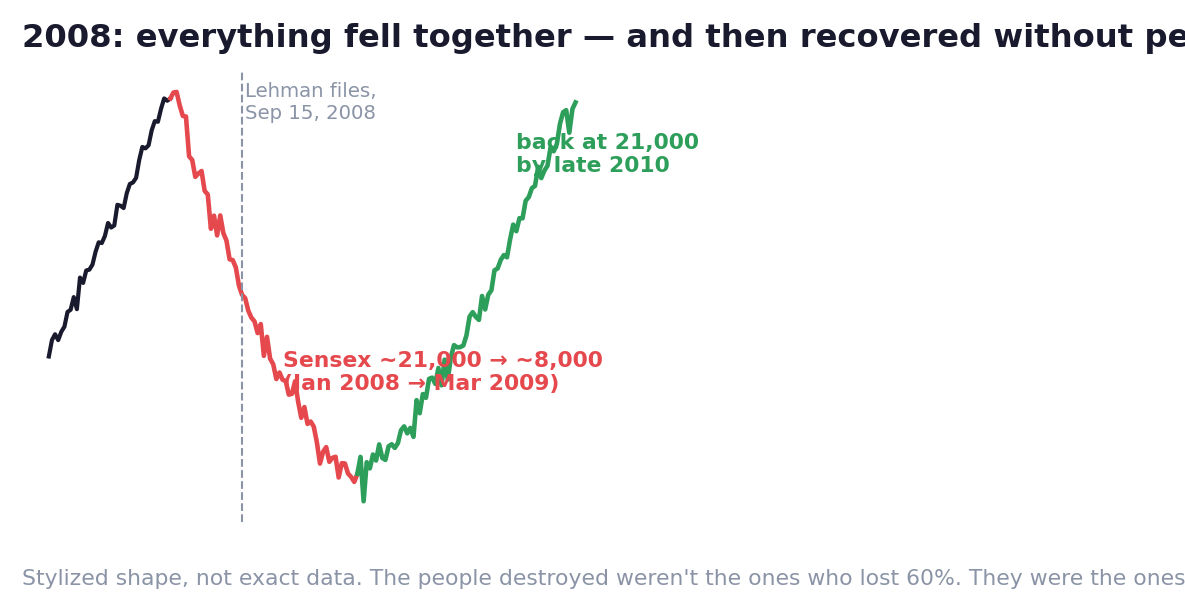
Sensex ~21,200 → ~8,200 (≈−60%); US markets ≈−57%; nearly every asset class fell together
Recovery
Sensex regained ~21,000 by late 2010 — about two years from the bottom
What changed
Global banking rules rewritten (capital, leverage limits); 'too big to fail' entered the language
Here's the chain nobody drew on a whiteboard until it snapped.
A family in Florida takes a home loan they can't afford — offered happily by a bank, because the bank isn't keeping the loan.
The bank sells the loan to Wall Street. Wall Street bundles thousands of such loans into packages, gets them stamped AAA — safest possible by rating agencies, and sells the packages to banks, pension funds and insurers across the planet.
Everyone holds them. Everyone borrows against them. Some institutions are leveraged 30-to-1 — meaning a 3% fall in their assets wipes out their entire capital.
The whole structure rests on one assumption, repeated like a prayer:
*US house prices never fall nationwide. They never have.*
(The turkey from Chapter 01 had the same quality of data.)
In 2007, house prices fell nationwide.
The AAA packages turned out to be full of loans that were never going to be repaid. Nobody knew which banks held how much of the poison — so banks stopped trusting each other. Lending froze.
On September 15, 2008, Lehman Brothers — a 158-year-old investment bank — went bankrupt. Not rescued. Gone.
And the world discovered the real lesson of 2008: everything was connected to everything.
Indian banks had almost no exposure to US home loans. It didn't matter. Foreign investors, desperate for cash at home, sold whatever they could sell — and Indian stocks were sellable. The Sensex went from about 21,000 to about 8,000.
Stocks fell. Real estate fell. Commodities fell. 'Diversified' portfolios discovered that in a true panic, correlations go to one — everything falls together, because everyone is selling everything to raise cash.
Now the part of the story that almost nobody tells properly.
The market came back. The Sensex was back at 21,000 by late 2010 — roughly two years.
So who was actually destroyed by 2008?
Not the investor who watched, sick to the stomach, as the portfolio fell 60% — and did nothing, or kept their SIP running. That investor was made whole and then some.
The permanent losers were the forced sellers: the leveraged, who got margin calls at the bottom; the ones who'd invested next year's tuition money and had to withdraw; the panicked, who sold in March 2009 to make the pain stop — days before the fastest rally of their lifetime.
2008 didn't destroy people randomly.
It destroyed, with brutal precision, everyone who had made themselves unable to wait.
🦢 Why Nobody Saw It Coming
The 'impossible' event was written directly into the models: US housing had never fallen nationwide, so the models said it never would. Layers of AAA stamps and complexity hid the fact that the entire global system was one bet on one assumption. And almost nobody imagined that Indian stocks would crash 60% over Florida mortgages — the connections were invisible until they all tightened at once.
⏳ The Time Machine
If you were there: The trades that saved people in 2008 were made in 2006: no leverage, no money with deadlines in the market, an emergency fund outside it. Armed with those three, the correct 2008 move was almost embarrassingly passive — keep the SIP running, watch the −60%, and be made whole by 2010. Every forced seller — margin calls, tuition bills, panic — donated their recovery to someone patient.
If it repeats tomorrow: Assume correlations go to one: in the next true panic, your 'diversified' stocks all fall together, so real diversification is cash and earning power. Audit hidden linkages — what single assumption do all your assets quietly share? And pre-commit your crash behaviour now: the SIP that continues automatically is worth more than the analysis you'll attempt at the bottom.
🛡️ The Survival Rules
- Leverage converts a drawdown into a death. Every borrowed rupee shortens the fall you can survive. At 30:1, a 3% move ends you; even at 3:1, a 2008 ends you. Decide your leverage using crisis math, not normal-day math.
- Never invest money that has a deadline. Funds you need within a couple of years can't be exposed to a market that can halve and take two years to return. The crisis chooses when to arrive; your tuition bill doesn't move.
- In a panic, diversification across stocks isn't enough — everything sellable falls together. True crisis diversification is having cash and an emergency fund, so you are never the forced seller.
- The recovery never sends an invitation. March 2009 felt like the end of capitalism; it was the buying opportunity of a generation. Plan today for how you'll behave at −50%, because you won't be able to think clearly there.
- Trust chains, not stamps. AAA meant nothing once the assumption beneath it broke. Ask what an investment actually depends on — not what label it wears.
Key Takeaway
2008 proved everything is connected, everything can fall together, and leverage plus deadlines turn a 60% drawdown into permanent ruin. The market recovered in two years — the only people it destroyed forever were those who had made themselves unable to wait.
Think About It
If the market halved next month and stayed down for two years — which of your actual life plans breaks? That answer, not your risk appetite, is your true risk capacity.
Swan Lab — The Deadline Audit
Make three honest lists:
2008's casualty list was built from exactly these three numbers.
If list one isn't zero, list two isn't 6+, and list three isn't comfortable at half today's prices — you now know your homework, and it has a deadline you don't control.