
Look at the moon tonight.
You'll see a face.
You've seen it since you were a child. Almost every human on Earth sees it.
But there is no face.
There are only craters and shadows.
Look at the clouds long enough and you'll find a dragon, a rabbit, a ship.
Look at a wall socket and it looks surprised.
Look at the front of a car and it has eyes and a mouth.
Why does this happen?
Because your brain is a pattern machine.
It runs day and night, scanning everything you see, hunting for shapes it recognizes — and it has no off switch.
This, too, is survival wiring.
Imagine one of your ancestors hearing a rustle in the tall grass.
If she assumes it's a tiger and runs — and it's just the wind — she loses nothing but a little energy.
If she assumes it's the wind — and it's a tiger — she's gone.
So evolution made a simple choice:
it's far safer to see a pattern that isn't there than to miss one that is.
Your brain would rather find a hundred fake tigers than miss one real one.
Which brings us to a famous classroom experiment.
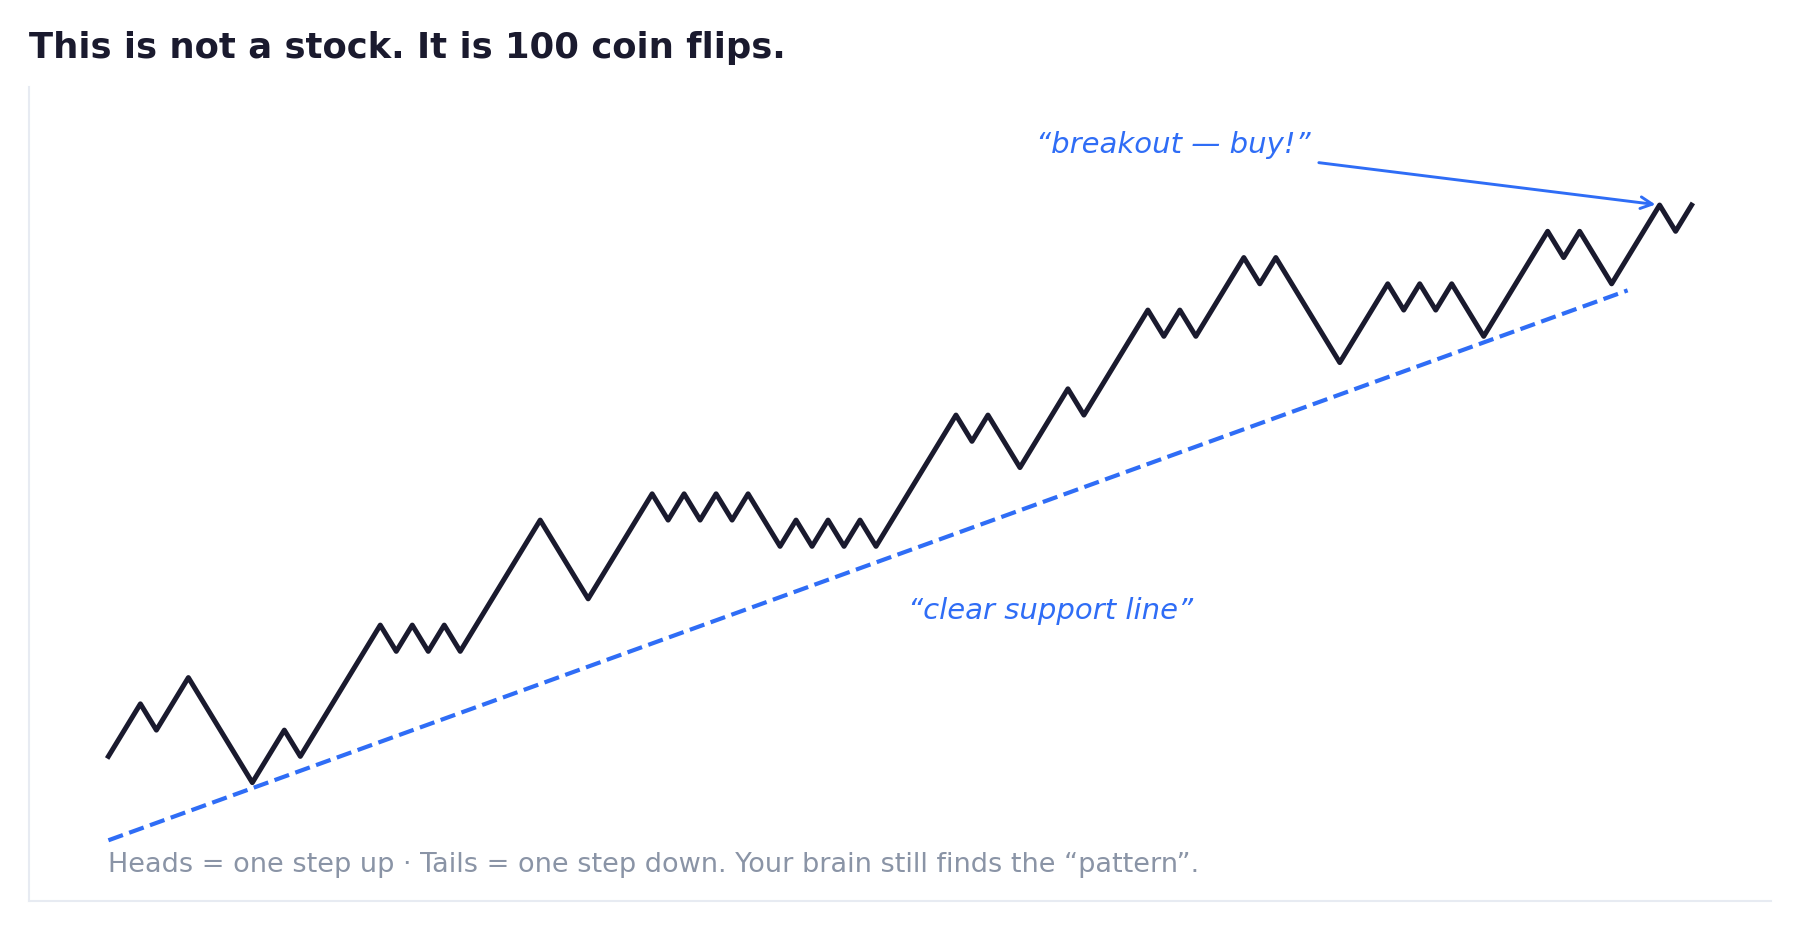
A finance professor once gave his students a coin.
They flipped it again and again.
Heads — draw the line one step up.
Tails — draw the line one step down.
Flip after flip, the line wandered across the page.
When they were done, they had a chart built from pure chance. No company. No news. No value. Just a coin.
The professor showed the chart to a professional chart analyst.
The analyst studied it with great interest.
He found a trend.
He found support levels.
He found a pattern forming — and urged that this stock should be bought immediately.
When the professor revealed that the "stock" was a coin, the analyst was not amused.
Sit with that for a moment.
A trained expert looked at pure randomness...
...and saw meaning.
Not because he was foolish.
Because he was human, and human brains see faces in the moon.
Now, here's what this chapter is not saying.
It is not saying that all chart patterns are fake, or that studying charts is useless.
Real forces do move markets — you learned them in the School of Market Science. Buyers, sellers, liquidity, the order book.
The problem is sharper than that:
your eyes cannot tell the difference between a real pattern and a random one.
Both look identical.
Both feel equally convincing.
The face in the moon feels just as real as the face of an actual person.
This is why serious traders never trust a pattern just because they can see it.
They test it.
They ask: has this pattern actually worked across hundreds of past examples — or does it just look like it should?
Feeling sure is not evidence.
Your brain plays the same trick with stories.
Every evening, the news explains the market's day.
"Stocks fell today as investors took profits."
"Stocks rose today on renewed optimism."
Notice something strange: the explanation always arrives after the move.
If the same journalists truly understood the cause, they could tell you tomorrow's story today.
They can't.
Nobody can.
The story is stitched together afterwards, because your brain — and everyone else's — finds an unexplained event unbearable.
A story feels like understanding.
But a story written after the result is not understanding.
It's decoration.
Key Takeaway
Your brain finds patterns everywhere — even in pure randomness — and it cannot tell the difference by looking. Seeing a pattern is not evidence that the pattern is real. Testing is.
Think About It
If a chart drawn from coin flips can fool a professional analyst, how would you know whether the pattern you spotted today is a real signal... or a face in a cloud?
Psychology Lab — Flip Your Own Chart
Build the coin-flip chart yourself. It takes five minutes.
Take a coin and a piece of paper. Start a line in the middle of the page.
Flip the coin 50 times. Heads: draw the line one step up. Tails: one step down.
Look at what you've drawn. You'll likely see "trends," "support," maybe even a "breakout."
Now show it to someone who follows the markets — without telling them how it was made — and ask: "Would you buy this stock?"
Listen carefully to their analysis.
Then tell them it was a coin.
You will never look at a chart the same way again.